Quick question – what’s the difference between your high-volume and low-volume stores?
If you can’t come up with a quick answer, you’re not alone. Granted, there are a lot of differences between stores that make it hard to quickly compare performance. Some stores are newer and others due for upgrades. And some are in locations with higher traffic than others. But these factors don’t tell the whole story, and they aren’t straightforward differentiators that you can quickly adjust to increase store revenues.
What’s missing?
Let’s take a look at some key metrics that you can use to not only analyze but also improve performance.
Look at the Right Data to Increase Revenue
At Alert Tech, we spend a lot of time helping retailers improve revenue-driving metrics. What we find is that even top stores may not be performing at the level they could. Usually, this is something the brand is aware of on some level – it’s not uncommon for us to hear some version of, “We knew in our gut that something was off but couldn’t put their finger on exactly what it was.”
In order to tell what’s actually going on, we rely on data – and although door traffic is a good start, isn’t not enough. We see high-traffic, low-volume stores all the time, so obviously there’s something happening between the door and the cashwrap that’s affecting shopper conversion. There are actual metrics we can use to get clear on what this is.
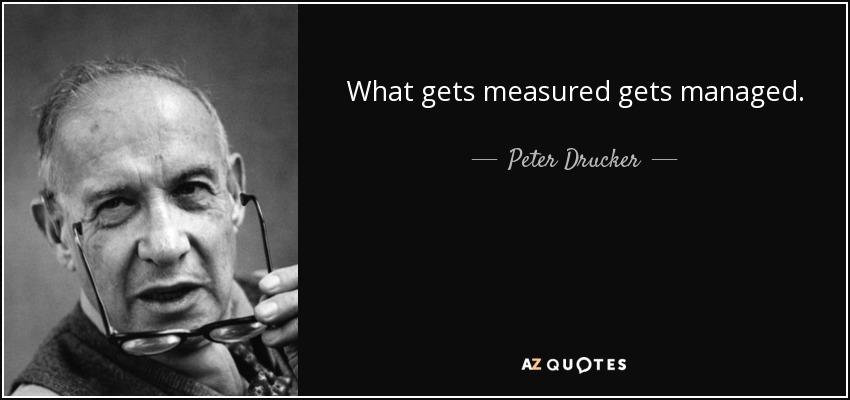
You’ve heard the Peter Drucker quotes, “What gets measured gets managed,” and “What’s measured improves.” If you measure these in-store performance indicators, you can not only compare stores but begin to move the bar and increase sales.
So, what factors should you be looking at?

Peter Drucker. (n.d.). AZQuotes.com. Retrieved May 12, 2016, from AZQuotes.com Web site: http://www.azquotes.com/quote/547204
Where to Look for Retail KPIs
Historically, a lack of high-quality benchmark data has been a significant barrier to analyzing and improving the performance of a retail store.
That’s changed.
For an apparel store, the humble fitting room is the richest source of such data. It’s the area of the store where the moment of truth on a purchase occurs. Consider the following statistics about fitting room usage:
- Shoppers who use fitting rooms are almost 7 TIMES more likely to buy compared to those who simply browse the sales floor
- Shoppers who enter the fitting room on a regular basis are TWICE as likely to make a purchase
- Shoppers who receive service in the fitting room are THREE TIMES as likely to make a purchase
- If a customer does not visit the fitting room, it DOUBLES the likelihood of that customer returning part of their purchase
Once you understand how this important the fitting room is to your shopper’s journey, you’ll look to fitting room data to take out the guesswork in this area of your store.
[Tweet “Take the guesswork out of retail store performance”]
Fitting Room KPIs
You probably use people counters at the entrance to the store, but do you use similar traffic counters to see how many customers visit your fitting rooms? This critical piece of information is one of the best indicators of overall store sales health and one of the key performance indicators (KPIs) for fitting rooms. Fitting room KPIs include:
- the number of fitting room visits
- the length of fitting room visits
- the number of calls for assistance in the fitting room
- the time it took to respond to fitting room calls
Simply put, comparing KPIs to benchmarks reveals opportunities to increase fitting room traffic and improve customer service. For example, a lack of visits to the fitting room could indicate that your associates aren’t focusing on inviting shoppers to try on clothing. Or if customers don’t receive timely help in the fitting room, they could leave the store on a sour note. But you can’t do anything to address these challenges until you identify the issue in the first place.
[Tweet “Comparing KPIs to benchmarks lets retailers improve #CustomerExperience”]
Use Benchmark Data to Drive Improvement
These KPIs are powerful, but of course, seeing room for improvement is only the first step. Use this information to adjust processes and procedures, and you’ll find that data-driven solutions will both boost sales and increase customer satisfaction.
Retail Analytics: How to Collect Retail Data, and What to Do With It
[xyz-ihs snippet=”TOFU2-Retail-Analytics”]
